
Skip to content

IT consulting

GLPI help desks and Zabbix monitoring, implemented and supported.

We set up and support your help desk in GLPI and your monitoring in Zabbix: every request with a ticket number and an owner, and an alert when a server, a link or a service fails.

Help desk · GLPI

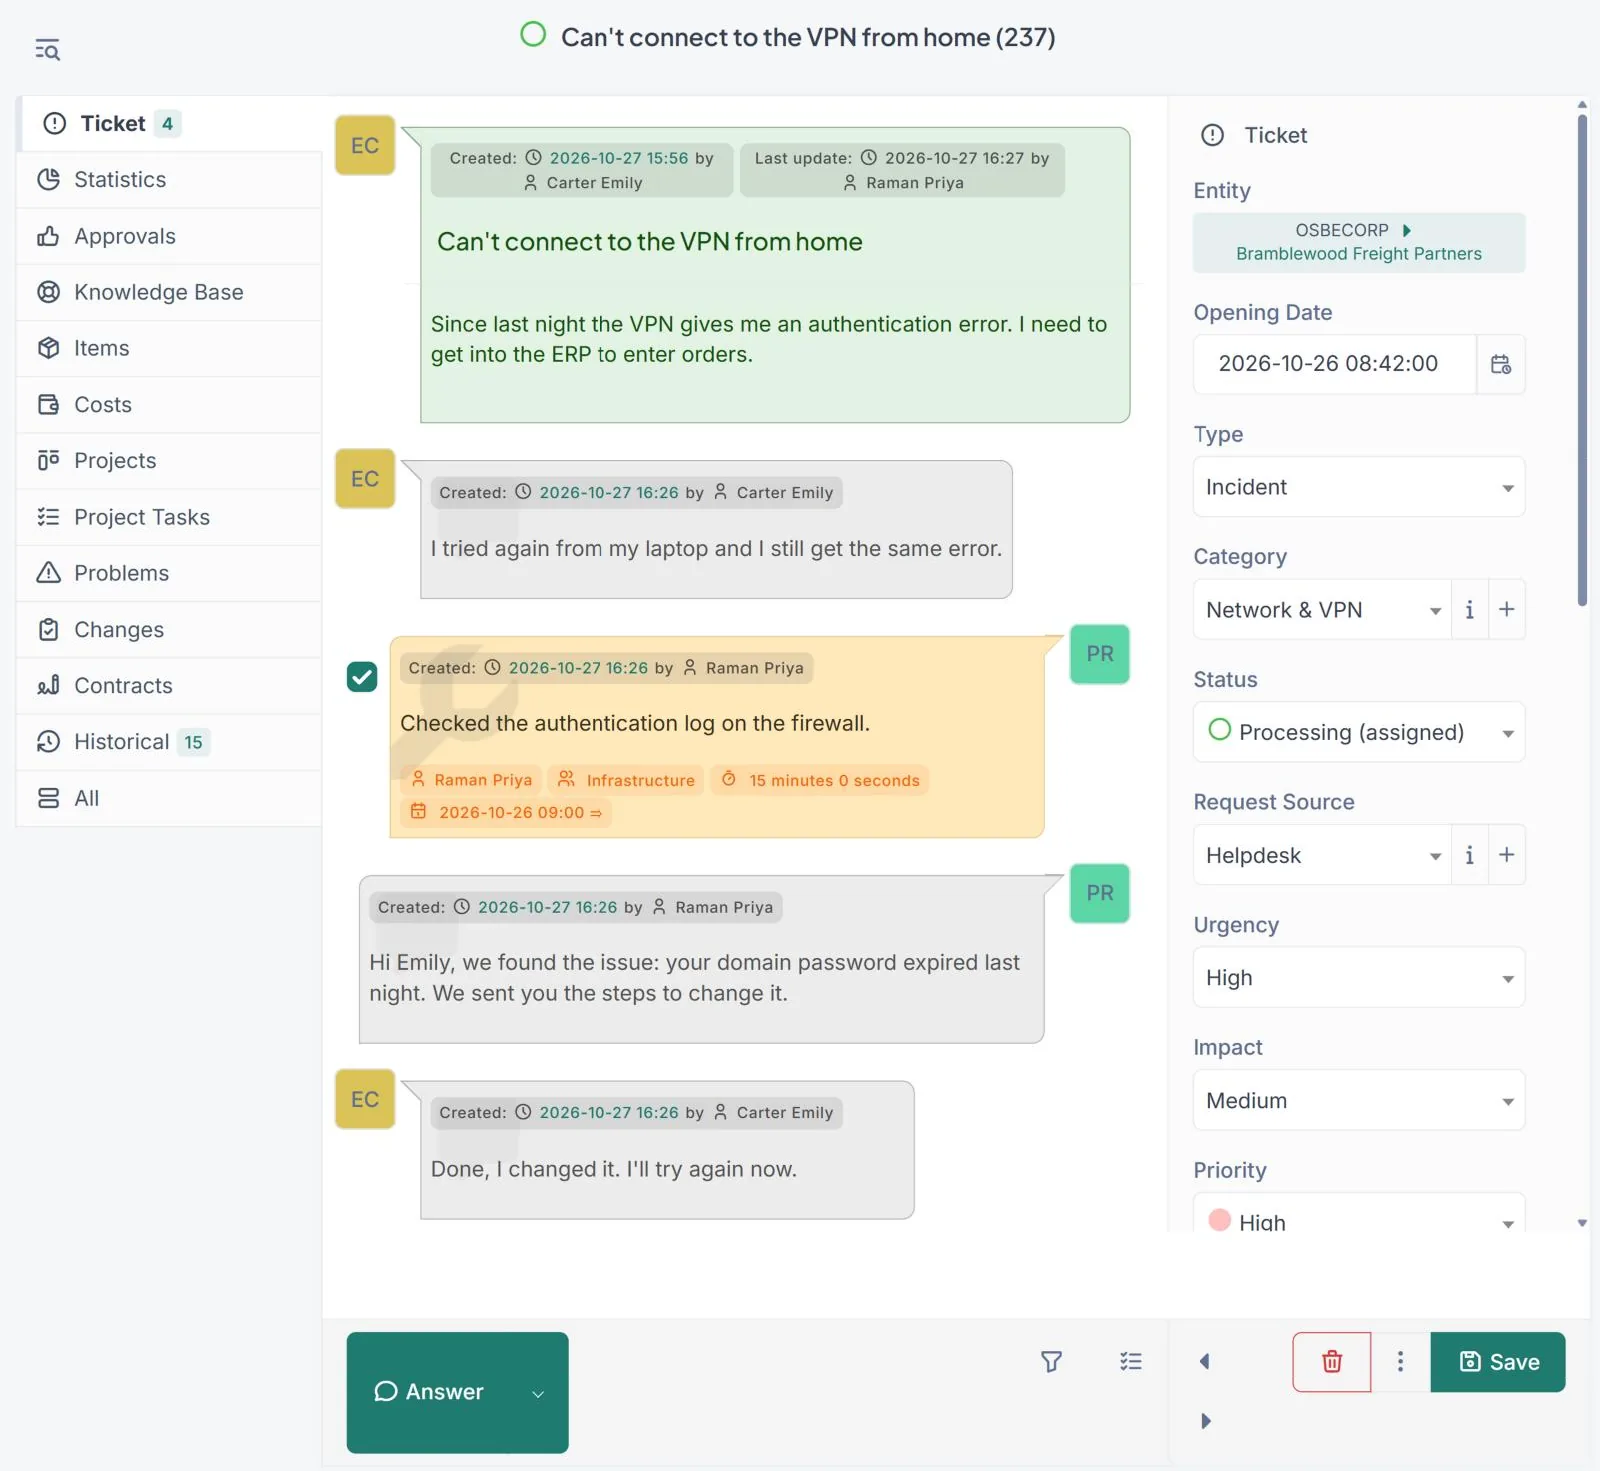
A GLPI ticket with the conversation between the user and the technician, the logged task, and the priority and status fields

Monitoring · Zabbix

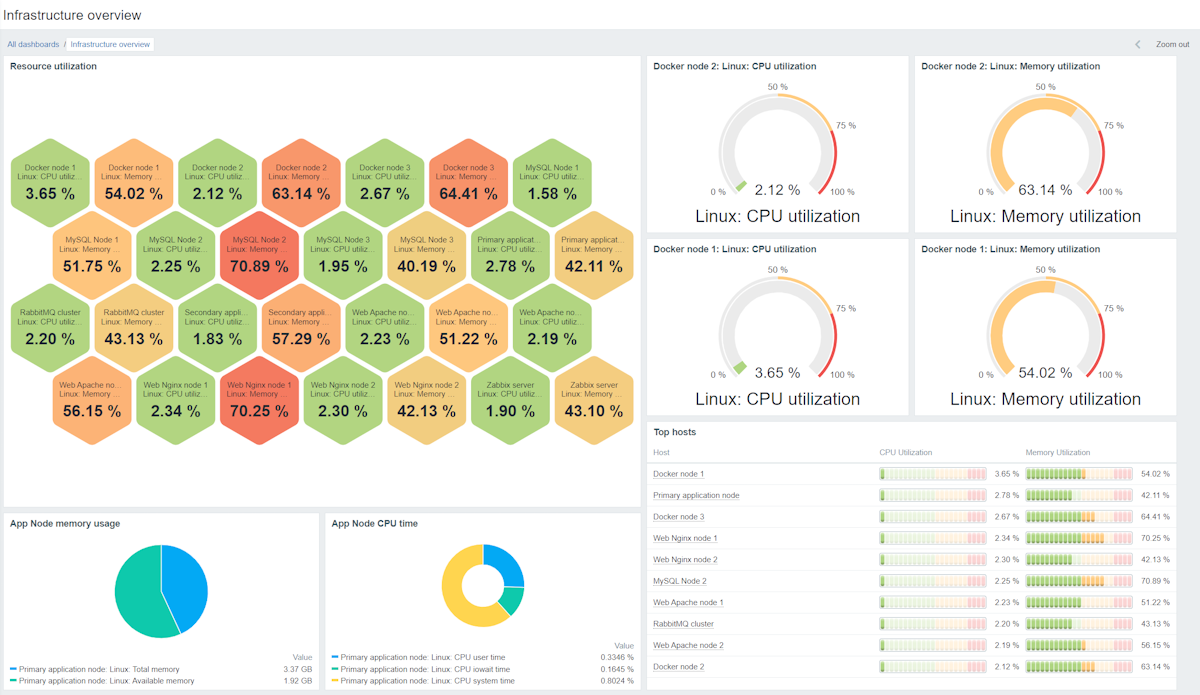
A Zabbix 7.0 LTS dashboard with CPU and memory usage by server, capacity indicators and a host ranking

What happens when IT support runs without a system.

Some problems look normal because they've been around for years. They still take time your team could spend on more important work.

One request, three channels and no owner.

A user emailed, then sent a message on Teams, then called. Now there are three conversations and nobody knows who's working on the problem.

Bring every request into one place, assign an owner and track each case from start to finish.

Get requests organized
An outage your users reported first.

The service stopped responding a while ago. Your team only finds out when the complaints start.

Monitor what matters and set up alerts that help you catch problems and act.

Catch problems earlier

To-dos that live in someone's memory.

Tasks nobody logged, follow-ups that never happen and information spread across people and tools.

Define support workflows, automate repetitive tasks and keep the history where everyone can find it.

Improve my processes

Start with what you most need to fix.

Help desk and IT assets

Every request with an owner, a priority and a status.

Organize support, set priorities, link requests to devices and see what's happening in your help desk.

Organize my help desk
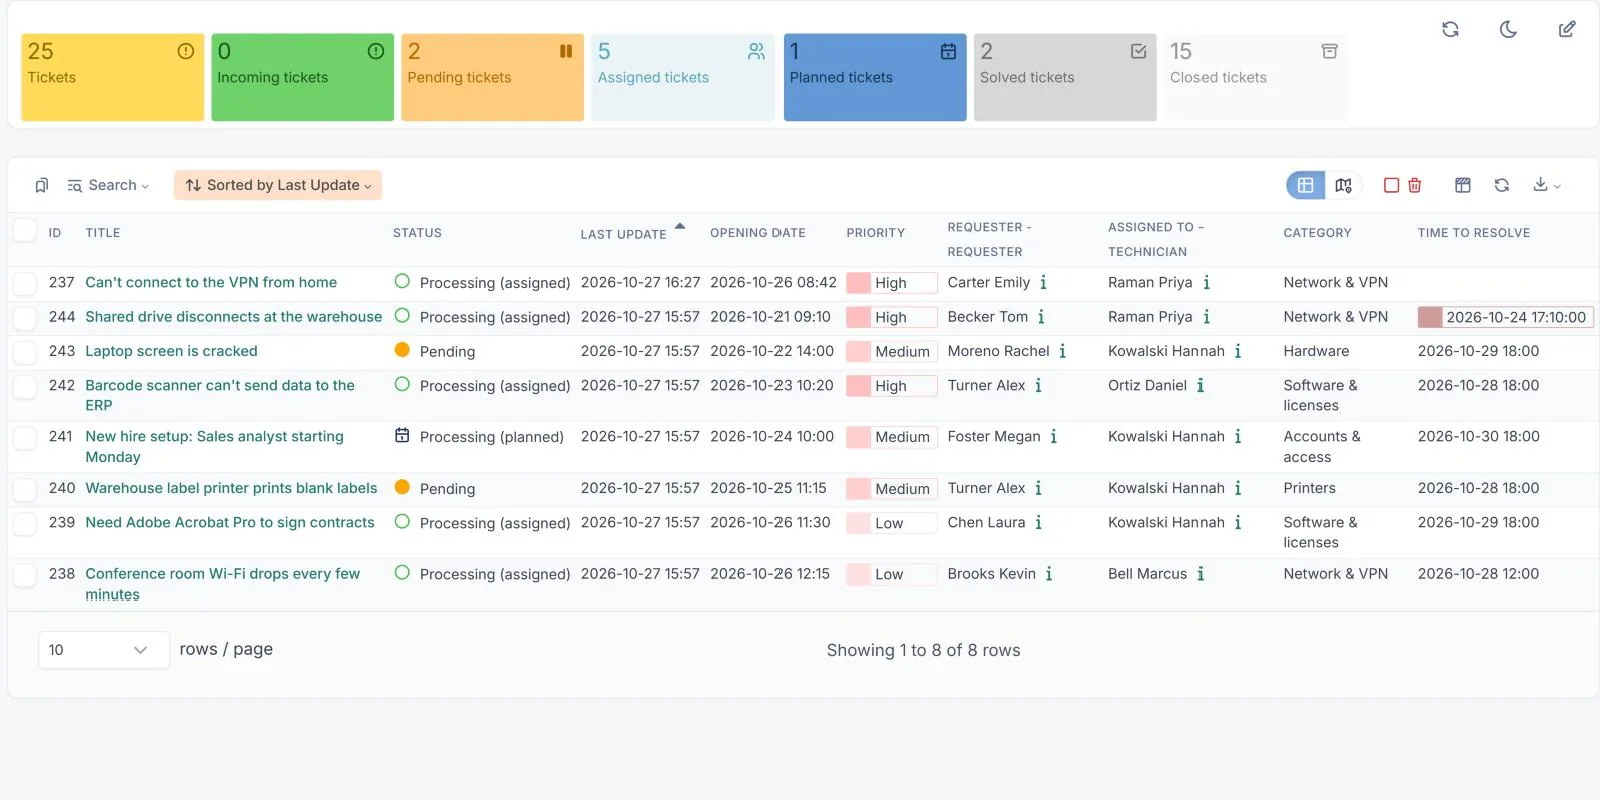
A GLPI ticket list with counters by status, priority, requester, assigned technician, category and time to resolve

Infrastructure monitoring

Alerts that arrive before the complaints.

Monitor servers, networks and services. Spot abnormal behavior and get the alerts that matter to your operation.

Monitor my infrastructure
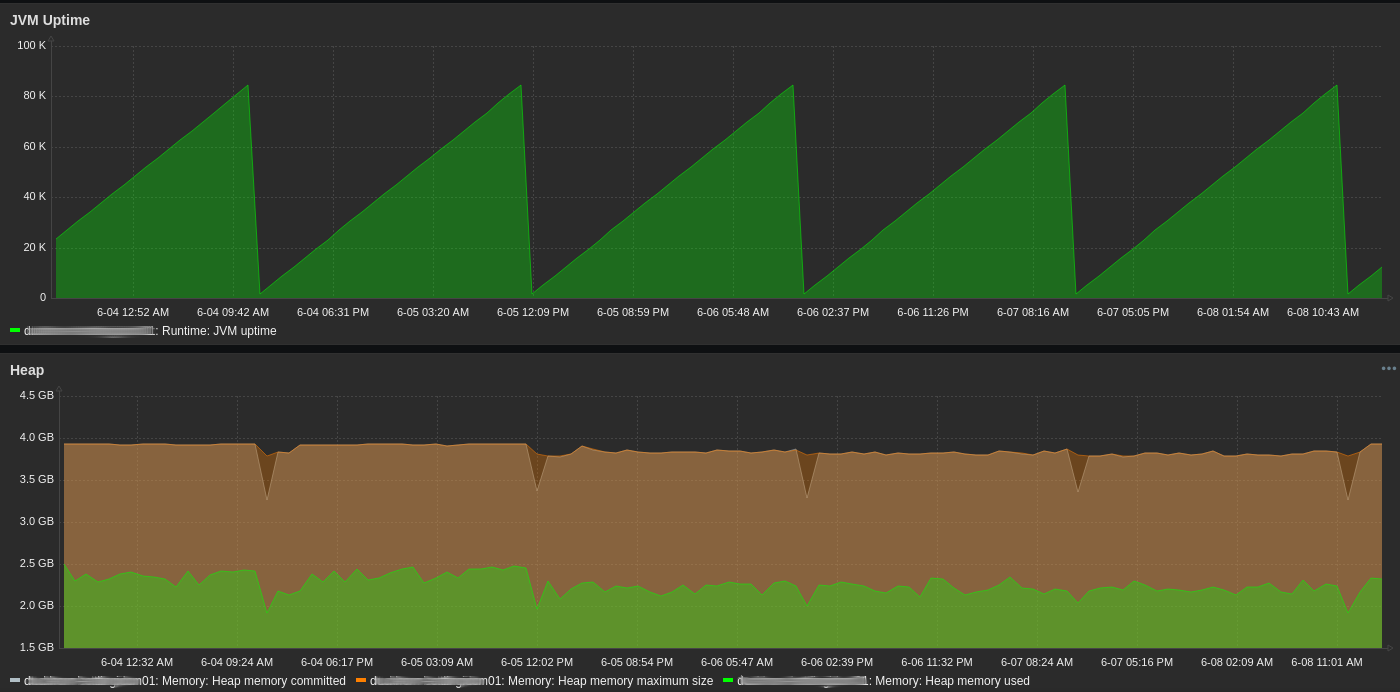
Zabbix 7 LTS history graphs: uptime of a Java service that restarts periodically, and memory usage

We configure each tool around the way your team works.

A help desk can have hundreds of settings and still be awkward to use. A monitoring system can send thousands of alerts and still miss the one that matters.

That's why we start by understanding how you work, what's slowing your operation down and what you need to solve.

  1. 01

    We know IT work

    We know what it takes to keep things running while users wait for answers and infrastructure needs attention.

  2. 02

    We work with what you have

    There's no need to start over. We can review your installation, fix what's wrong and get more out of the tools you already use.

  3. 03

    You talk to the specialists

    Your request goes straight to the people who implement, configure, develop and troubleshoot.

Tell us what's going on. We'll help you find where to start.

  1. 1

    You tell us what you need to solve.

  2. 2

    We review the context and define the work.

  3. 3

    We send you a proposal with the agreed scope.

Talk to a specialist

WhatsApp