
Zabbix implementation
“We want to start monitoring our systems.”
Zabbix server, agents, network devices, services, templates, discovery and alerts, based on the agreed scope.
Implement ZabbixImplementation, support and upgrades
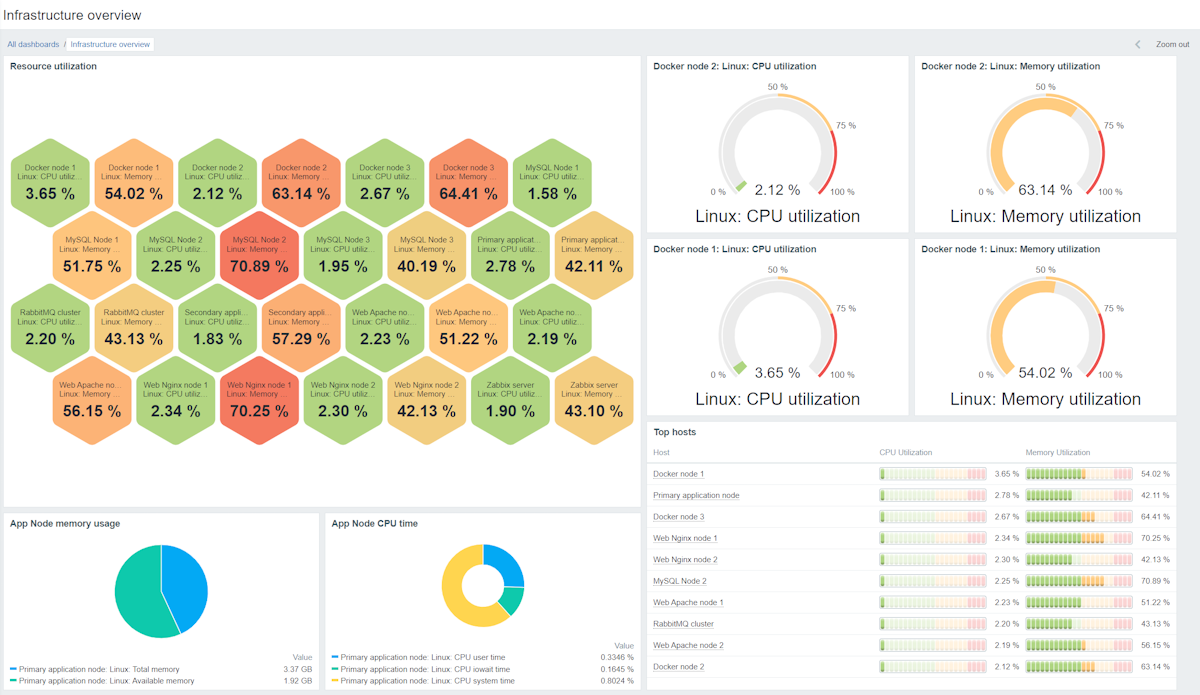
Zabbix is an open source monitoring system. It spots an overloaded server, a degrading link or a service that stops responding, and alerts the person on your team who needs to act.
We implement it from scratch or tune the one you already run.
“You find out about an outage when someone calls.”
“You get so many alerts that the important ones get lost.”
“Some critical servers or services aren't monitored at all.”
“You have graphs, but you don't know which problem to tackle first.”
Availability, performance, capacity and service health monitoring.
Thresholds, dependencies and recipients defined around your operation.
History, metrics and events to analyze problems and trends.
Zabbix covers everything from a server running out of disk space to a link that starts dropping packets.
Zabbix services
“We want to start monitoring our systems.”
Zabbix server, agents, network devices, services, templates, discovery and alerts, based on the agreed scope.
Implement Zabbix“We already have Zabbix, but it's too noisy.”
A review of triggers, thresholds, dependencies, recipients and coverage.
Tune my alerts“Our Zabbix is out of date and we don't want to break anything.”
We plan the version upgrade: we review templates, integrations and configuration, test first and upgrade with a backup in place.
Upgrade my Zabbix“Something's not working and we need it fixed.”
Errors, slowness, overloaded processes or data that stops coming in. We find the cause and fix it with your team.
Get Zabbix support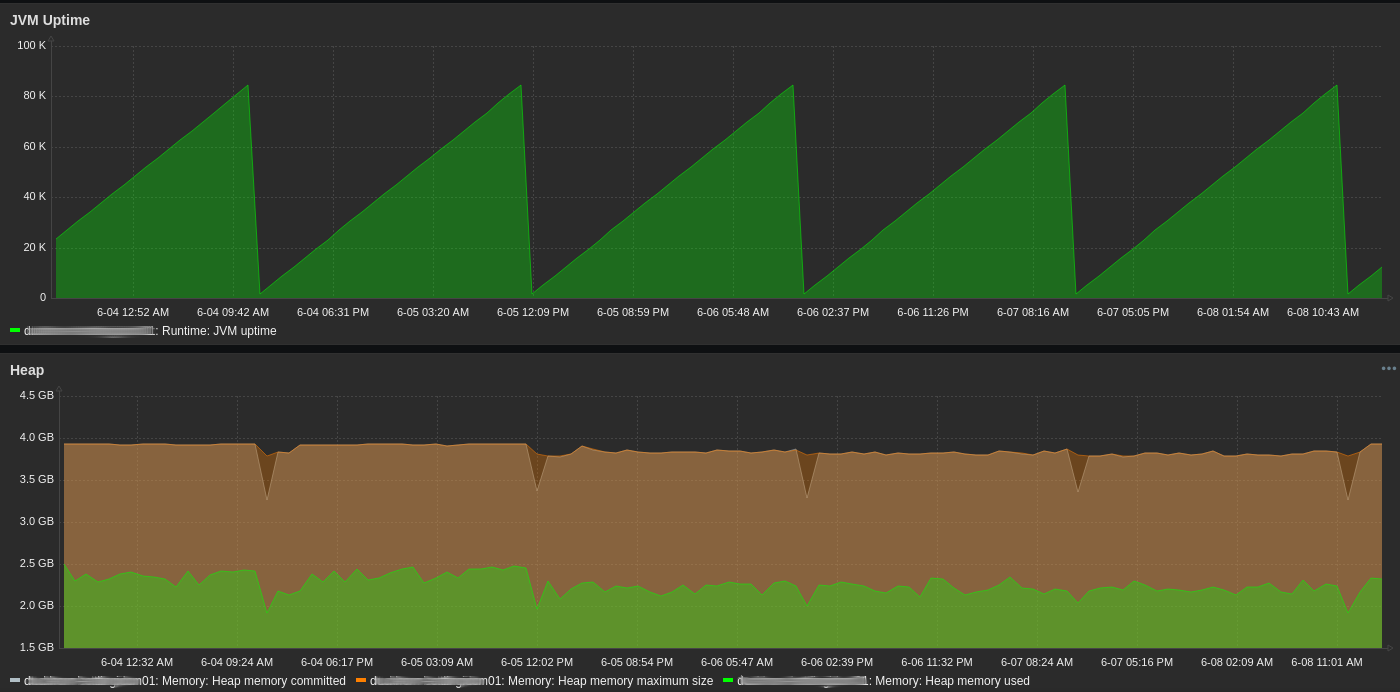
Monitoring provides the availability, capacity and event data that several standards require.
Zabbix doesn't certify anything; it produces the records and metrics you present in an audit. Integrated with GLPI, each event can open an incident with its own follow-up.
Also running a help desk? Zabbix events can open GLPI tickets automatically. See GLPI consulting
Yes. We review templates, triggers and notifications to cut the noise and cover what isn't being monitored today.
Linux and Windows servers, network devices over SNMP, web services, databases and applications. What to monitor, and with which thresholds, is defined around your operation.
It needs a server (physical, virtual or in a cloud you manage) and network access to whatever is being monitored. Its size depends on the number of hosts and metrics.
Yes. Zabbix is open source and has no license fee. What you pay for is the server it runs on and the work to implement and maintain it.
Yes, in whatever format we agree on: alert tuning, new hosts, upgrades or technical support. The scope is put in writing.
Send us your list of servers, network devices and services, and we'll put together a proposal.